Repeaters on MMAR - Radioamador
MMAR - Radioamador has introduced the ability to look up repeaters based on geographic location: you just type a coordinate and a search radius. The only thing to watch out for is that, although it’s very functional and fast, some repeaters may have incorrect records — there are even coordinates in the middle of the North Atlantic.
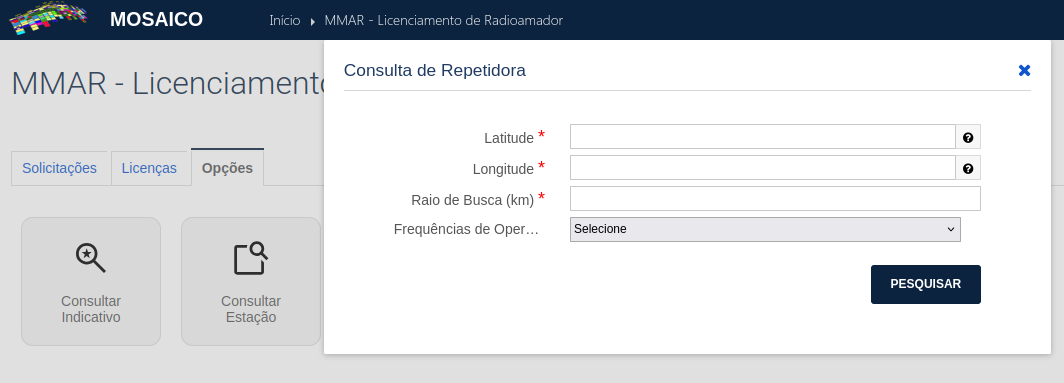
To look one up, just click Consultar Repetidora in the Opções tab and enter
the geographic coordinate. Tip: you can copy it directly from Google Maps, and
when you paste it, it will automatically split into latitude and longitude:
Plotting the locations on a map
Seeing the geographic location is already very useful, but it’s much more interesting to visualize the points on a map. To do that you can use a script to render the locations on the map, and you can see the result below:
Open the repeaters map in full screen
The map’s search box takes either a callsign or a frequency: since the search
plugin matches any part of the indexed text, the script joins both into the same
label. So typing PY2ARV finds that repeater, and typing 146,170 lists every
repeater operating on that frequency. The MMAR CSV uses a comma as the decimal
separator, but the script normalizes what you type: 146.170 with a dot finds
the same repeaters. Multiband repeaters show all of their frequency pairs in the
same entry.
The script that generates this map, based on the CSV file you can retrieve from
the MMAR - Radioamador lookup, is shown below. To run it, just execute the
command uv run plot.py in the same directory as the CSV named
repetidoras.csv:
# /// script
# dependencies = [
# "pandas",
# "folium",
# "datetime"
# ]
# ///
import pandas as pd
import folium
from folium.plugins import MarkerCluster, Search
from datetime import datetime
# 1. Load data
df = pd.read_csv('repetidoras.csv', sep=';')
# 2. Create map (no default tiles: layers are added below)
mapa = folium.Map(
location=[-15.7801, -47.9292],
zoom_start=4,
max_zoom=13,
tiles=None
)
# 2.1 Background layers (map selector to view states/cities)
# Voyager is the default: shows city names and main roads while staying light.
folium.TileLayer('CartoDB voyager', name='Voyager (cities and roads)').add_to(mapa)
folium.TileLayer('OpenStreetMap', name='OpenStreetMap (detailed streets)').add_to(mapa)
folium.TileLayer('CartoDB positron', name='Light (CartoDB Positron)').add_to(mapa)
folium.TileLayer(
tiles='https://server.arcgisonline.com/ArcGIS/rest/services/World_Imagery/MapServer/tile/{z}/{y}/{x}',
attr='Esri, Maxar, Earthstar Geographics',
name='Satellite (Esri)'
).add_to(mapa)
# 2.2 Label overlay (city and road names) — useful over satellite
folium.TileLayer(
tiles='https://{s}.basemaps.cartocdn.com/rastertiles/voyager_only_labels/{z}/{x}/{y}{r}.png',
attr='© OpenStreetMap, © CARTO',
name='Labels (cities and roads)',
overlay=True,
control=True,
show=False
).add_to(mapa)
# 3. Add the reference date (floating text)
data_hoje = datetime.now().strftime("%d/%m/%Y")
texto_data = f"""
<div style="position: fixed;
bottom: 50px; left: 50px; width: 200px; height: 30px;
background-color: white; border:2px solid grey; z-index:9999; font-size:14px;
padding: 5px; text-align: center;"> Generated on: {data_hoje}
</div>
"""
mapa.get_root().html.add_child(folium.Element(texto_data))
# 3.1 Make the cluster bubbles semi-transparent (see cities underneath)
css_clusters = """
<style>
.marker-cluster { background-clip: padding-box; }
.marker-cluster-small { background-color: rgba(110, 204, 57, 0.45); }
.marker-cluster-small div { background-color: rgba(110, 204, 57, 0.75); }
.marker-cluster-medium { background-color: rgba(240, 194, 12, 0.45); }
.marker-cluster-medium div { background-color: rgba(240, 194, 12, 0.75); }
.marker-cluster-large { background-color: rgba(241, 128, 23, 0.45); }
.marker-cluster-large div { background-color: rgba(241, 128, 23, 0.75); }
/* Search now matches callsign + frequency: the entries are longer */
.leaflet-control-search .search-input { width: 220px; }
.leaflet-control-search .search-tooltip { max-width: 420px; }
.leaflet-control-search .search-tip { white-space: nowrap; }
/* Responsive: compact search and layer selector on small/portrait screens */
@media (max-width: 600px) {
.leaflet-control-search .search-input { width: 130px; font-size: 12px; }
.leaflet-control-search { margin-right: 6px !important; }
/* Long labels (callsign + frequencies) wrap instead of overflowing the screen */
.leaflet-control-search .search-tooltip { max-width: 60vw; max-height: 45vh; }
.leaflet-control-search .search-tip {
white-space: normal;
font-size: 12px;
line-height: 1.3;
}
.leaflet-control-layers-expanded {
max-width: 150px;
max-height: 40vh;
overflow-y: auto;
font-size: 12px;
padding: 6px 8px;
line-height: 1.3;
}
.leaflet-control-layers label { margin-bottom: 2px; }
.leaflet-top.leaflet-right { max-width: 55vw; }
}
</style>
"""
mapa.get_root().html.add_child(folium.Element(css_clusters))
# 4. Marker cluster: clicking opens overlapping markers (same address)
marker_cluster = MarkerCluster(
name="Repeaters",
options={
# At max zoom the click "spiderfies" the stacked markers
"spiderfyOnMaxZoom": True,
"zoomToBoundsOnClick": True,
# A larger distance between the spiderfy "legs" helps separate repeaters
"spiderfyDistanceMultiplier": 2,
# Groups only very close markers, reducing crowding
"maxClusterRadius": 40,
},
).add_to(mapa)
def formatar_frequencias(valor):
"""The CSV lists multiband repeaters with one frequency pair per line."""
if pd.isna(valor):
return []
return [linha.strip() for linha in str(valor).splitlines() if linha.strip()]
# 4.1 GeoJSON layer used by the search (properties are searchable in JS)
features = []
rotulos_usados = {}
for _, linha in df.iterrows():
indicativo = str(linha['Indicativo'])
frequencias = formatar_frequencias(linha['Frequência de Operação'])
freq_html = '<br>'.join(frequencias) if frequencias else 'not available'
info = f"<b>{indicativo}</b><br>Freq: {freq_html}"
# Text indexed by the search: since the plugin matches any part of the label,
# joining callsign and frequencies allows searching for both in one field.
rotulo = f"{indicativo} — {' · '.join(frequencias)}" if frequencias else indicativo
# The plugin indexes records by label: a suffix keeps repeaters with identical
# callsign and frequencies from overwriting each other in the search.
rotulos_usados[rotulo] = rotulos_usados.get(rotulo, 0) + 1
if rotulos_usados[rotulo] > 1:
rotulo = f"{rotulo} ({rotulos_usados[rotulo]})"
# Visual marker (inside the cluster)
folium.Marker(
location=[linha['Latitude'], linha['Longitude']],
popup=folium.Popup(info, max_width=300),
icon=folium.Icon(color='blue', icon='tower', prefix='fa')
).add_to(marker_cluster)
# Feature for searching by callsign or frequency
features.append({
"type": "Feature",
"geometry": {
"type": "Point",
"coordinates": [linha['Longitude'], linha['Latitude']],
},
"properties": {
"busca": rotulo,
"popup": info,
},
})
geojson_busca = folium.GeoJson(
{"type": "FeatureCollection", "features": features},
name="Search by callsign or frequency",
show=False, # search-only layer; keeps the map clean
# Invisible marker: the layer exists only to feed the search, so we don't want
# dots covering the map. The search label already shows callsign and
# frequencies; the full popup lives on the cluster markers.
marker=folium.CircleMarker(
radius=0, opacity=0, fill=False, fill_opacity=0, stroke=False
),
popup=folium.GeoJsonPopup(fields=["popup"], labels=False),
).add_to(mapa)
# 5. Search centers and applies a moderate zoom on the chosen result
Search(
layer=geojson_busca,
search_label='busca',
geom_type='Point',
placeholder="Search callsign or frequency...",
collapsed=False,
search_zoom=12,
).add_to(mapa)
# 5.1 Accept a dot as the decimal separator in the search
# The plugin strips dots from the typed text before building the regex, so
# "146.170" would become "146170" and never match the "146,170" in the CSV.
# Swapping dot for comma before the default filter makes both spellings work.
# The snippet goes in the body, which the browser runs before the script that
# creates the search control — required because the plugin stores the function
# reference when it is constructed.
js_ponto_ou_virgula = """
<script>
(function () {
var filtro_padrao = L.Control.Search.prototype._defaultFilterData;
L.Control.Search.prototype._defaultFilterData = function (texto, registros) {
return filtro_padrao.call(this, texto.replace(/\./g, ','), registros);
};
})();
</script>
"""
mapa.get_root().html.add_child(folium.Element(js_ponto_ou_virgula))
# 6. Layer control (switch background maps)
folium.LayerControl(collapsed=False).add_to(mapa)
mapa.save('mapa_repetidoras.html')
print(f"Map generated successfully! Reference date: {data_hoje}")